Advanced Scoring Weights for Fantasy Baseball 2026
The 2026 Advanced Scoring Weights
Hi Folks,
If you play in a Rotisserie league, our Draft Advisory software is designed
to give you the opportunity to favor the more predictable categories in your
league. Instead of each category having an even “1 to 1” weighting,
this method provides an opportunity to play the percentages of predictability.
This is accomplished by giving different weights to each Roto category that are
relevant to your league scoring. As widely known by baseball fans, categories
such as Batting Average can fluctuate wildly on a yearly basis. So wouldn’t it
make sense to slightly underweight that category when creating your rankings?
Within the Setup|Edit
League Settings section, select the Rotisserie scoring option and
check the Advanced option located above the scoring grid. This scoring option
will allow you to weigh each Rotisserie category according to your preference.
Although most leagues use an equal weighing for each Rotisserie category some
leagues do not. Even if your league uses an equal weighing system, it’s
important to understand that not every statistical category has an equal
predictability.
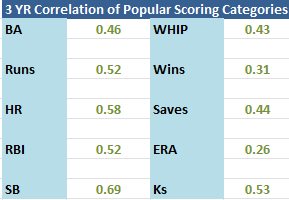
From a predictability standpoint, here is a
recent 3 year correlation in forecasting for each of the following player stat
categories :
(See more category correlations by clicking
here).
In the statistical term of correlation, the
range of correlation ranges from -1 to +1, with 1.00 considered a perfect “fit”,
the better the fit the more reliable the forecast. A .20 is considered a loose
correlation, .4 a good correlation, and .6 a very good fit. Thus we know that
there is a higher predictability in forecasting
Homeruns, Stolen Bases, Pitcher’s Strikeouts, and
WHIP. NNeutral categories typically include
Runs Batted In and Runs Scored/font>.
Categories that offer poor predictability year over year includes
Batting Average, ERA, and Wins.
For those who would like to play the
percentages, ffor 2026 we suggest the following weighing within
these typical categories. As an example of what these weighting signify, Batting
Average entered in as a .8, basically weighs the Batting Average category at
80%, while the Stolen Base category (which is very predictable) is entered as a
1.2, will weigh the category at 120% when calculating the player valuation and
rankings.
What has changed since we ran the analysis
the previous season?/span>
Among the
typical 5×5 batting categories, the weightings remain the same as last
season. On the pitching/strong> side: Wins aare
slightly less predictable (based on a 3 year average), going from suggested
weighting of .8 to .7, while Strikeouts became slightly less
weighed but still very predictable from our suggested weighting of 1.4 to a 1.3,
and WHIP /strong> aappears
more predictable (increasing from a suggested weighing of 1.2 to 1.3).

(See more categories for the Advanced settings by clicking
here, remember to ONLY USE THE SCORING
CATEGORIES THAT YOUR LEAGUE USES!/strong>)
Overall, the tweaking discussed above won’t
dramatically change the rankings, but you will be be increasing the odds of
predictability for your team during your draft…and whenever there is an
statistical advantage to gain, it’s something worth exploiting. – Anthony
Draft
Advisor: bring our winning strategy (Serpentine / Auction)
to your draft. Our player rankings adjust as players are selected, adhering to
the changing dynamics of your draft. After a player is selected/drafted, the
software will display/suggest the best players remaining. Click here to
purchase and start
dominating your league/s today!