

When you’re riding, you can often feel a suspension seatpost moving beneath you. But have you ever wondered how much energy that movement absorbs, and whether it’s slowing you down?
In this lab test, I’ve analysed data from the Silverstone Sports Engineering Hub to quantify exactly how much that “bobbing” costs in terms of mechanical efficiency.
We don’t know the exact seatpost models used in the test, but the aim isn’t to compare specific products. Instead, the goal is to understand the efficiency difference between a rigid and a suspension seatpost on both a smooth road surface and a rough cobbled surface.
Let’s dive in.
How the Pedalling Efficiency Rig Measures Bike Performance
The Pedalling Efficiency Rig is a bicycle dynamometer that measures rider input power at the pedals and compares it to the output power delivered to the roller. By analysing the difference between the two, the system calculates total mechanical losses in a tightly controlled environment.
This setup is particularly useful for isolating variables such as seatpost compliance, tyre pressure, tyre and wheel selection, bearing performance, drivetrain configuration, chain lubrication, and even frame compliance – all of which influence how much of your effort ultimately reaches the road.
The fork is secured to a solid mounting block, allowing the bike to pivot and roll while remaining fixed in position. Although this arrangement doesn’t perfectly replicate real-world terrain dynamics, anchoring the bike significantly improves repeatability and consistency between test runs.
Because the testing takes place indoors, there is no real aerodynamic drag acting on the rider. Instead, aerodynamic resistance is simulated using precisely calibrated electromagnetic resistance applied to the roller, based on wheel speed and the drag-velocity profile of a rider with a given CdA.
Method: Controlled Seatpost Efficiency Testing

This test compares a rigid seatpost with a suspension seatpost across different speeds, surfaces and tyre pressures.
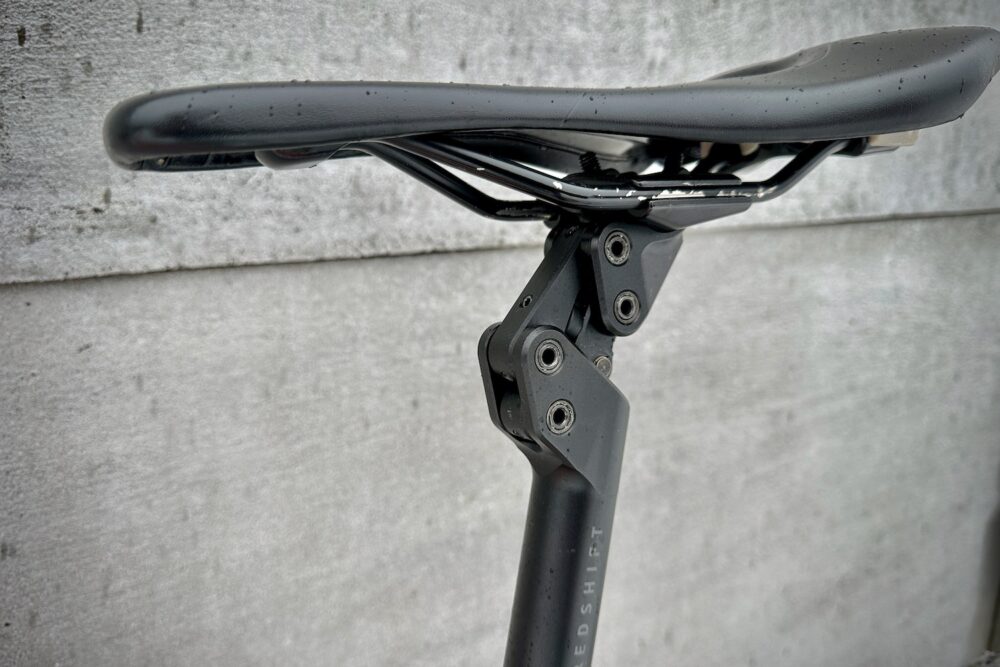
As I mentioned in the intro, Silverstone Sports Engineering Hub (SSEH) did not disclose the exact seatpost models used. However, based on close inspection of the photos, the suspension post appears to be a USE VYBE, which we recently reviewed HERE. The rigid post could be an S-Works FACT carbon model, as that is standard on the Specialized Crux Elite used in the test – though that remains even more speculative.
The rear wheel model was not specified, but most wheels are extremely stiff in the vertical plane, so its influence is likely minimal. The tyre is also unidentified, though it appears to be approximately 28 to 30 mm wide.
Initial tests were conducted on a simulated “smooth” road surface. Baseline speeds were 30, 35 and 40 km/h, with tyre pressure set at 80 psi.
The roller was then swapped for a simulated “cobbled” surface. Both seatposts were retested at 30 and 35 km/h using two tyre pressures: 50 psi and 70 psi. Each run was completed in the same gear, equating to a cadence of 90 rpm.
Power input was controlled for every speed and surface combination, ranging from roughly 130 watts to over 300 watts. The same rider was used throughout, maintaining an identical riding position for all tests.
Overall, this represents as tightly controlled a mechanical comparison as possible under laboratory conditions.
Data disclaimer: Silverstone Sports Engineering Hub’s original presentation omitted several methodological details. So I derived many figures presented here by analysing the efficiency and drag values shown in the published graphs. As such, the values should be considered highly informed estimates rather than directly reported measurements.
Bike Efficiency Lab Test Results
Simulated Smooth Road (80 psi)
| Speed | Total Efficiency: Suspension Seatpost | Watts Lost | Total Efficiency: Rigid Seatpost | Watts Lost | Efficiency Advantage |
|---|---|---|---|---|---|
| 30 km/h | 80% | 30.8 W | 82.5% | 25.5 W | Rigid +2.5% |
| 35 km/h | 84.2% | 35.2 W | 86.2% | 29.1 W | Rigid +2.0% |
| 40 km/h | 87.4% | 38.6 W | 88.9% | 32.2 W | Rigid +1.5% |
On the simulated smooth road, the suspension seatpost proved to be around 1.5 to 2.5% less efficient at transferring pedal power to the roller. In practical terms, that equates to roughly 5 to 6 watts lost, likely due to small amounts of vertical movement in the seatpost while pedalling.
As expected, efficiency increased with speed, because the same absolute losses represent a smaller proportion of total power.
At 40 km/h, overall mechanical efficiency reached nearly 89% with the rigid seatpost. This aligns closely with the findings from a lightweight vs aero frame comparison, where total efficiency at similar speeds fell between 89 and 90%.
Simulated Cobble Road (50 psi)
| Speed | Total Efficiency: Suspension Seatpost | Watts Lost | Total Efficiency: Rigid Seatpost | Watts Lost | Efficiency Advantage |
|---|---|---|---|---|---|
| 30 km/h | 58.9% | 74 W | 54.8% | 87 W | Suspension +4.1% |
| 35 km/h | 67% | 82.5 W | 63.5% | 96 W | Suspension +3.5% |
The results changed significantly on the simulated cobbled surface, particularly with the tyres set at 50 psi.
At 30 km/h, the suspension seatpost was approximately 4% more efficient than the rigid post (dropping slightly to around 3.5% at higher speeds). That represents a substantial 13 to 14-watt advantage, which is far from trivial.
In other words, on rougher surfaces, it’s the rigid seatpost that’s likely costing you meaningful speed.
Simulated Cobble Road (70 psi)
| Speed | Suspension Seatpost | Watts Lost | Rigid Seatpost | Watts Lost | Efficiency Advantage |
|---|---|---|---|---|---|
| 30 km/h | 52.2% | 101.2 W | 50% | 105.5 W | Suspension +2.2% |
| 35 km/h | 60.3% | 116.4 W | 59% | 122 W | Suspension +1.3% |
When tyre pressure was increased to 70 psi, the total drag rose sharply on the cobbled surface. Power losses increased by roughly 40% with the suspension seatpost and 20 to 30% with the rigid seatpost. This is expected, as higher air pressures reduce tyre deformation, increasing rolling resistance over rough terrain.
Under these conditions, the efficiency gap between the two seatposts narrowed considerably, shrinking to just a 1 to 2% advantage.
The takeaway is that tyre pressure plays a dominant role in efficiency over rough surfaces, and while a suspension seatpost can help, it cannot fully compensate for overly firm tyres.
How Much Speed Does a Suspension Seatpost Really Cost?

When installed on a road bike with narrow tyres, a suspension seatpost carries an efficiency penalty of roughly 5 to 6 watts at speeds between 30 and 40 km/h on smooth tarmac.
In practical terms, if you’re riding at 28 km/h on flat terrain, switching to a suspension seatpost would trim roughly 0.33 km/h from your speed – about 17 seconds over 10 kilometres. At 37 km/h, the reduction is nearer to 0.28 km/h, which works out to around 7 seconds per 10 kilometres.
Those are fairly small time losses. Still, if most of your riding is on smooth roads at moderate speeds, and you’d be just as comfortable on a rigid post, it’s something to think about.
Once the surface gets rough, however, the picture changes. On simulated cobbles, the suspension seatpost proved 13 to 14 watts more efficient, translating to about 0.8 km/h faster at 30 km/h. That’s a 2.8% gain, or roughly 32 seconds saved per 10 kilometres – plus you get a noticeable boost in comfort.
Keep in mind these results are based on a bike with relatively narrow tyres. On gravel bikes with wider rubber, or mountain bikes, the efficiency difference may be smaller, as the tyres themselves do more of the vibration damping.
Comparing Independent Data With Brand Testing

We don’t have a huge amount of independent data to fully validate these findings. However, Specialized did release a white paper comparing the Diverge STR (equipped with their Future Shock suspension seatpost system) to the standard Diverge fitted with a rigid seatpost.
As you’d expect, the study was funded by Specialized, so the findings are naturally presented in a way that showcases their product’s strengths. It’s also important to note that the test bikes were fitted with 45 mm tyres rather than 30 mm, and because the testing took place outdoors, both the front and rear of the bike influence the results, making it less of a like-for-like comparison.
Even so, when you line their numbers up against the SSEH data, the rolling efficiency gains fall into a similar range. At 25 km/h on rough roads, the Future Shock–equipped bike was reported to be 3% faster – a 44-second saving per 10 kilometres ridden.
Could Different Suspension Seatposts Perform Better?
The next question you might have is whether other suspension seatposts could perform better than the one used in this test.
At the CYCLINGABOUT Comfort Lab, we’ve measured vibration levels across a wide range of suspension seatposts, and their damping performance varies significantly depending on design.
In our high-frequency chatter test (conducted over a controlled obstacle), the USE VYBE, which I suspect was used in the SSEH lab test, actually performed around 20% worse than a rigid seatpost. The issue appears to be a “pogo stick” effect: its design allows rapid rebound, which increases the average accelerations recorded by our equipment. That quick rebound behaviour was noticeable both subjectively and in the accelerometer data.
By contrast, the Redshift ShockStop PRO Endurance stood out by a considerable margin, reducing high-frequency vibrations by nearly 20% compared to a rigid seatpost in the same test. Its movement is far better controlled, which I suspect would not only reduce the smooth-surface efficiency penalty but could potentially widen the performance gap in SSEH’s simulated cobble surface testing.
You can read our review of the Redshift ShockStop PRO Endurance seatpost HERE.
Suspension Seatpost Lockouts
Another thought is this: if suspension seatposts are more efficient on cobbled surfaces but less efficient on smooth roads, there would be a clear advantage to incorporating a lock-out, much like on a full-suspension bike. In theory, that would deliver the best of both worlds.
One design that effectively achieved something similar was the now-discontinued Specialized Diverge STR gravel bike (seen above). While it doesn’t use a suspension seatpost in the traditional sense, its rear Future Shock system performs a comparable function and can be locked out.
Perhaps that is something we should aim for in future suspension seatpost products?
Summary
After digging into all this data, it’s clear that suspension seatposts are a bit of a trade-off when it comes to efficiency.
On smooth roads, they might cost a little, but on rough surfaces, that’s where they really shine – soaking up bumps, saving you watts, and helping your ride feel smoother. If you spend a lot of time on rough terrain, a suspension seatpost will almost certainly make a difference.
In the end, it’s all about finding the right balance between comfort and performance, so you can ride longer, feel fresher, and keep your bike efficient.