

This edition of our Shock Value suspension-education series will get a little nerdy. We’re taking a shallow dive into leverage curves, anti-squat, and anti-rise. We’ll explain how these metrics can be useful when shopping for a full-suspension bike, and why they are still a bit flawed.
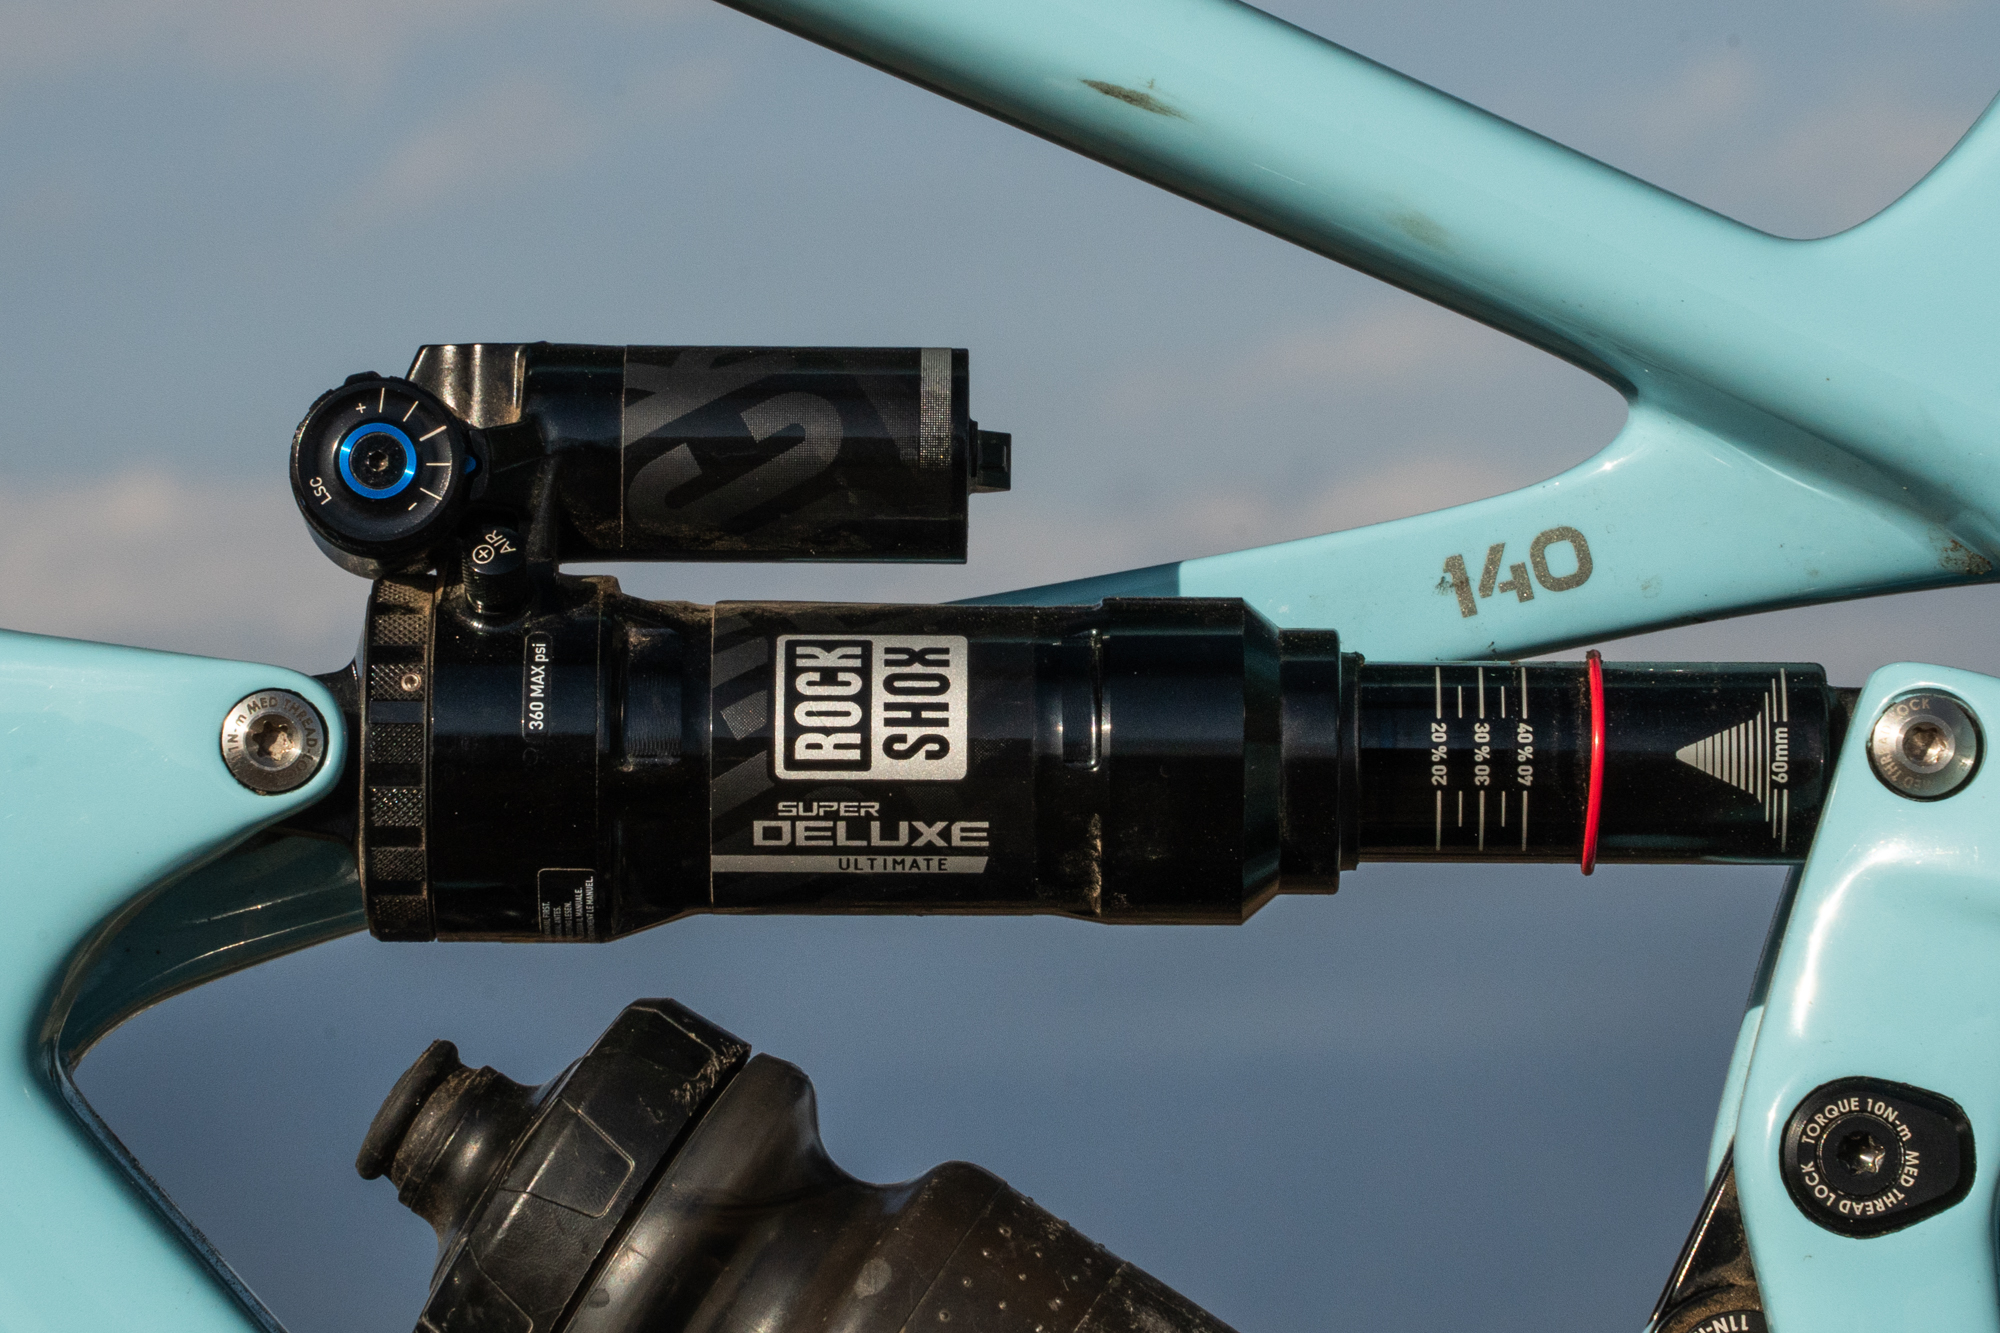
Shock Value is presented by RockShox
We all have emotional relationships with our bikes. So, when we publish a review on The Radavist, we put our hearts into it. We try to focus on how a bike feels, and how it makes us feel. But it also helps to sprinkle in some cold hard facts, like prices, weights, and geometry. And on full-suspension bikes, we can even mathematically quantify what that suspension is actually doing on the trail … kinda.
Bike brands often share charts that present an unbiased picture of how their rear-suspension linkage design interacts with the shock, with the drivetrain, and with the rear brake. They are not the whole picture, and are not wholly unbiased, but they’re still very useful. So, we’re here to offer a surface-level explanation of the three most common such charts.
Leverage-Ratio Curve
To understand a leverage-ratio curve (often shortened to just “leverage curve”), we should first understand the concept of a leverage ratio itself. Technically, a rear-suspension linkage is just a fancy lever. Meaning, it transfers the motion of the rear axle to the motion of the shock, and augments the force in the process.
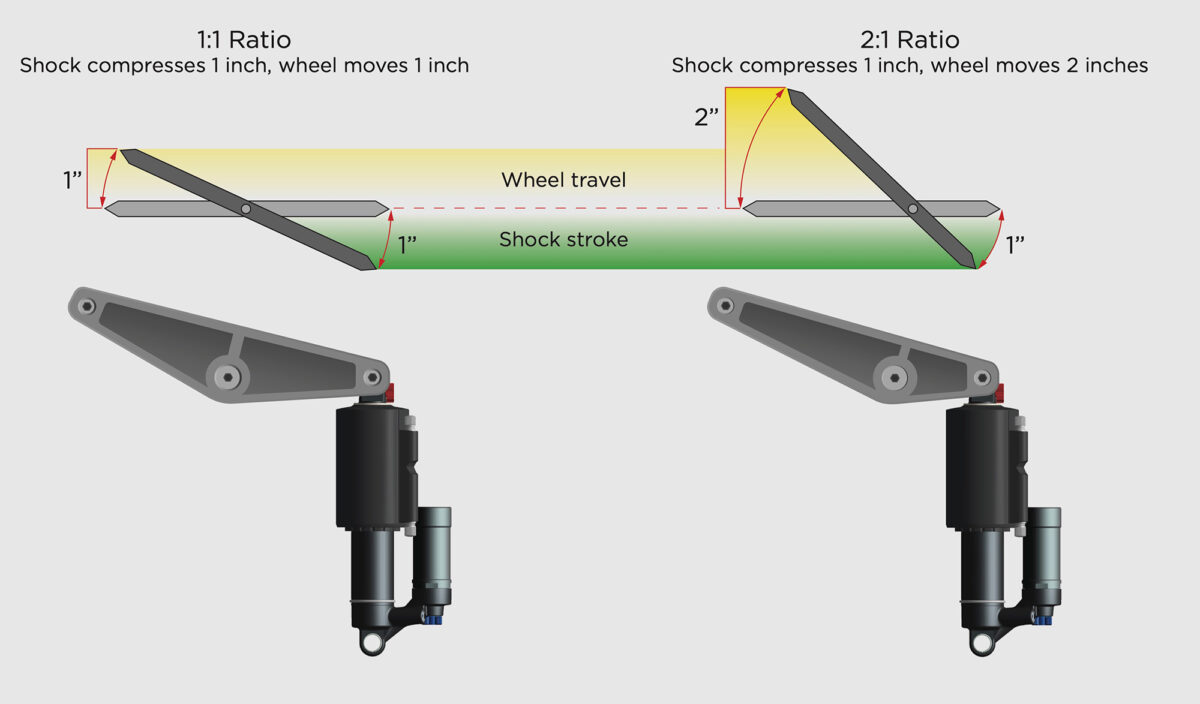
You can present the leverage ratio across those two points’ entire motion with a single value, like 2/1. As in, from start to finish, the rear axle moves 2X mm and the shock compresses X mm. But suspension engineers use a curve instead of a number because the leverage ratio will vary throughout the travel. The axle and shock move in an arch (or a series of arches), so that 2/1 ratio is not constant. Plot the changes on a graph, and the line curves. Early in the stroke, it may be 2.5/1, and late in the stroke, it may be 1.5/1. Or vice-versa.


This is purely a function of linkage and frame design. And it matters because a 2.5:1 ratio will feel a lot different than a 1.5:1 ratio depending on your settings, the shock spec, and a few other factors we’ll get into later. In the same way a designer might use geometry, component spec, and frame material to reach their desired ride characteristics, they can manipulate leverage curves to control the suspension characteristics. More “complex” linkages can offer them more granular control, but even single-pivot platforms will yield widely varying results based on what gets put where. These curves will tell you a lot, though like all the metrics we’ll explore here, they won’t tell you everything.
The Problem With Leverage-Ratio Curves
You can reliably compare measurements like head-tube angle, rotor size, or inner rim width from one brand to another. They always mean the same thing. But comparing one bike’s leverage curve to another is tricky. Largely because the shock itself plays a major role. Different brands, factory damping tunes, and air-spring volumes will behave differently. Also, different bikes will distribute your weight differently, so you may push through one bike’s support a tad more or less easily than another’s.
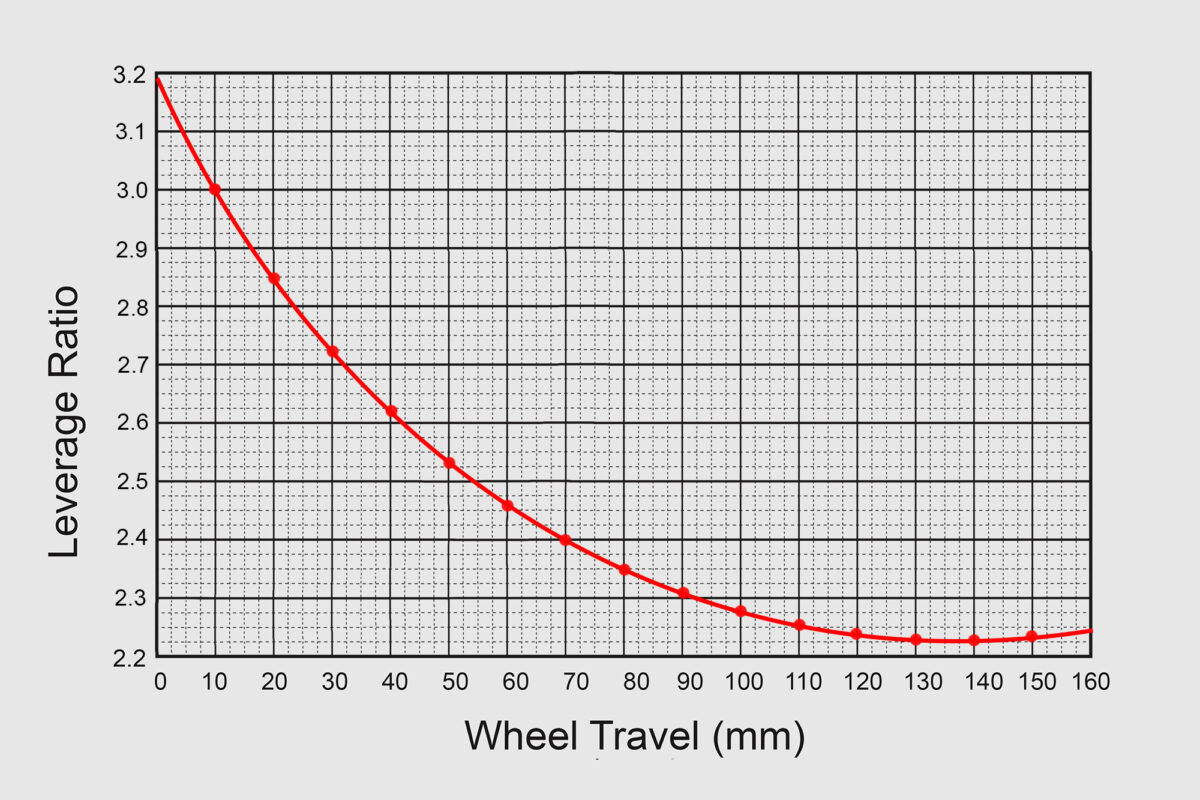
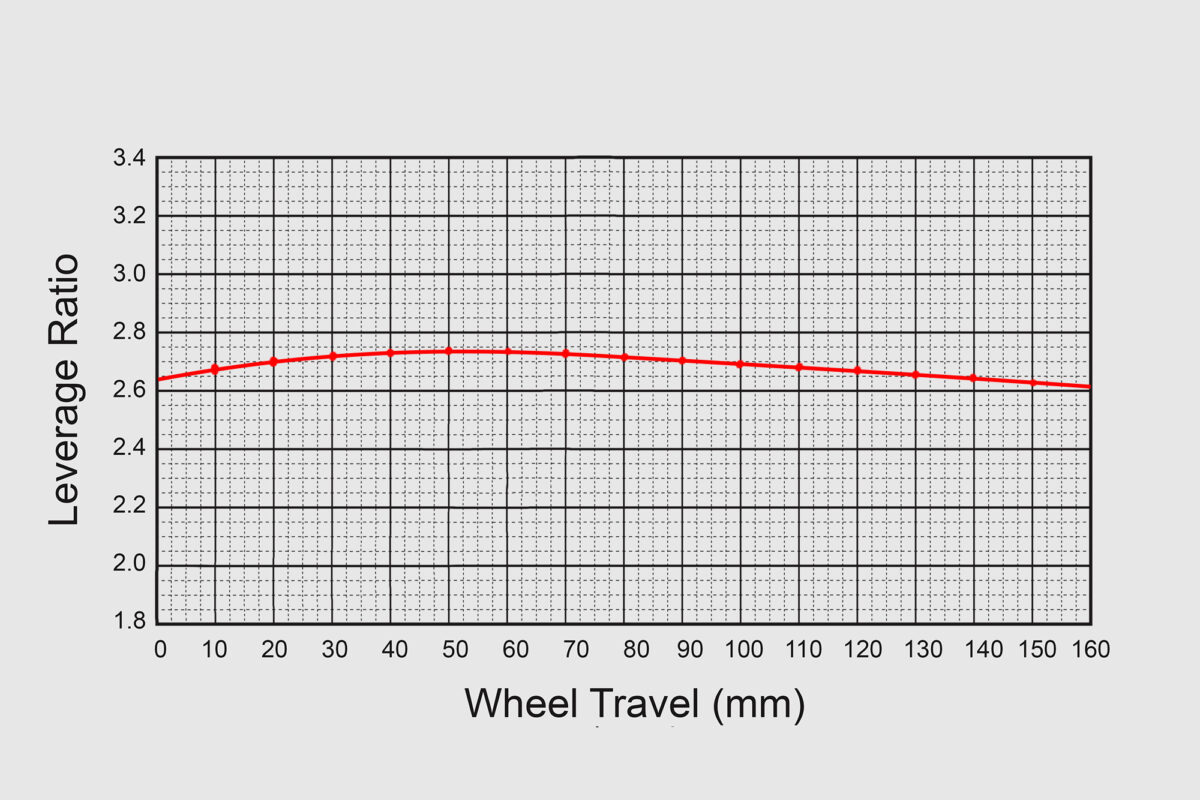
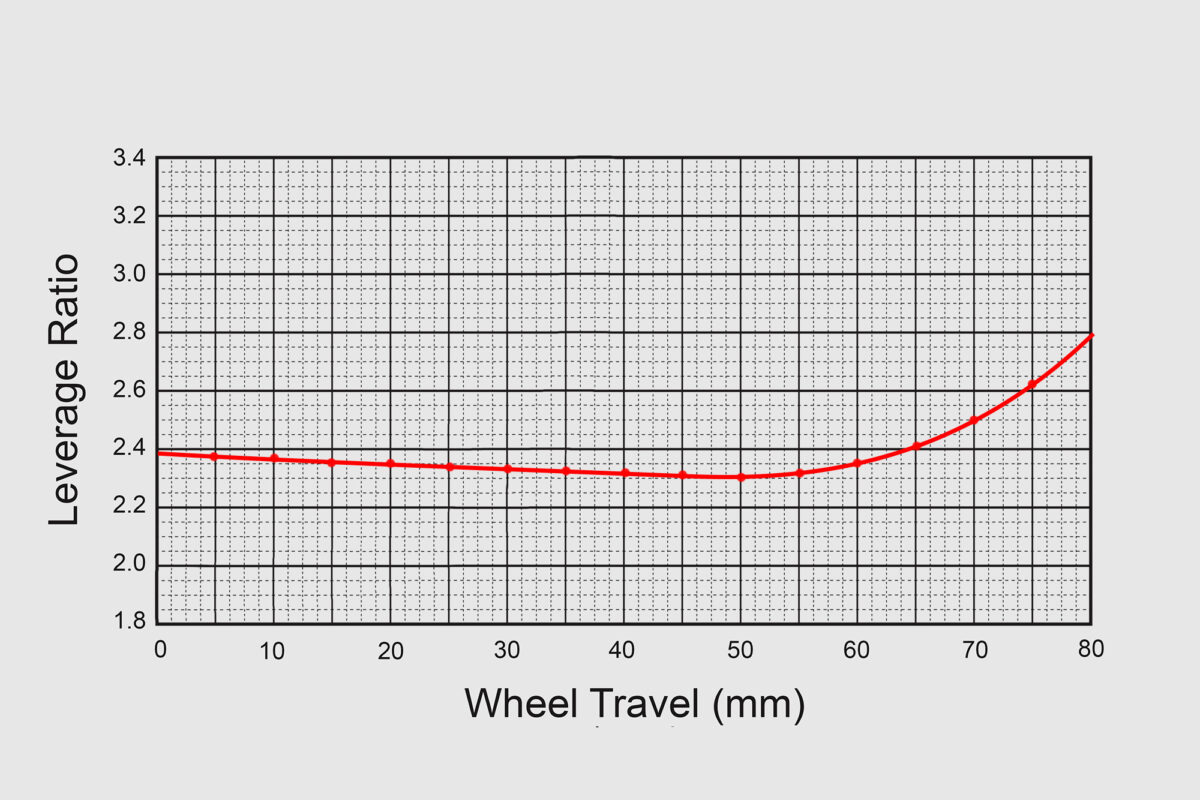
There’s also no standard for how these curves are represented. Above are two (hypothetical) leverage curves that are effectively identical, but look very different. These types of inconsistencies can make unbiased brand-to-brand comparisons difficult. The best solution is bikechecker.com’s Linkage app, which is a $25 program that allows you to view and compare user-generated kinematics data on a standardized graph. But not every bike is represented, and the ones that are may not be 100% accurate. Point is, take leverage curves with a grain of salt, but it always helps to have a basic understanding of them. So, let’s take three not uncommon types and break them down.
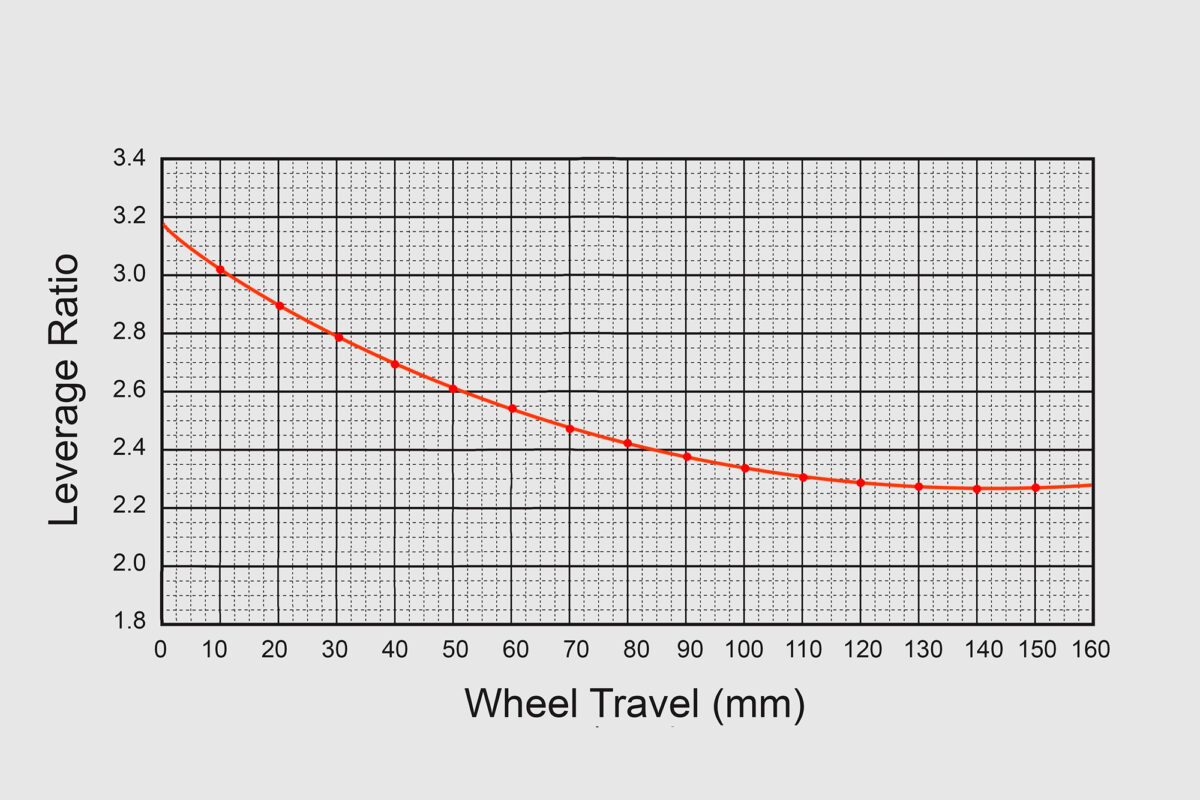
Progressive Curve
The majority of modern leverage curves are progressive in one way or another, so we’ll spend most of our time here. They’re also known as “rising-rate” curves, though eagle-eyed readers will notice that the line is dropping, not rising. This is because the numbers on the Y axis quantify the rear wheel’s mechanical advantage over the shock, and they decrease from top to bottom. As that mechanical advantage decreases, the perceived support increases. It’s a little counter-intuitive, but it’s the dominant way leverage ratios are presented, so we should all get used to it.
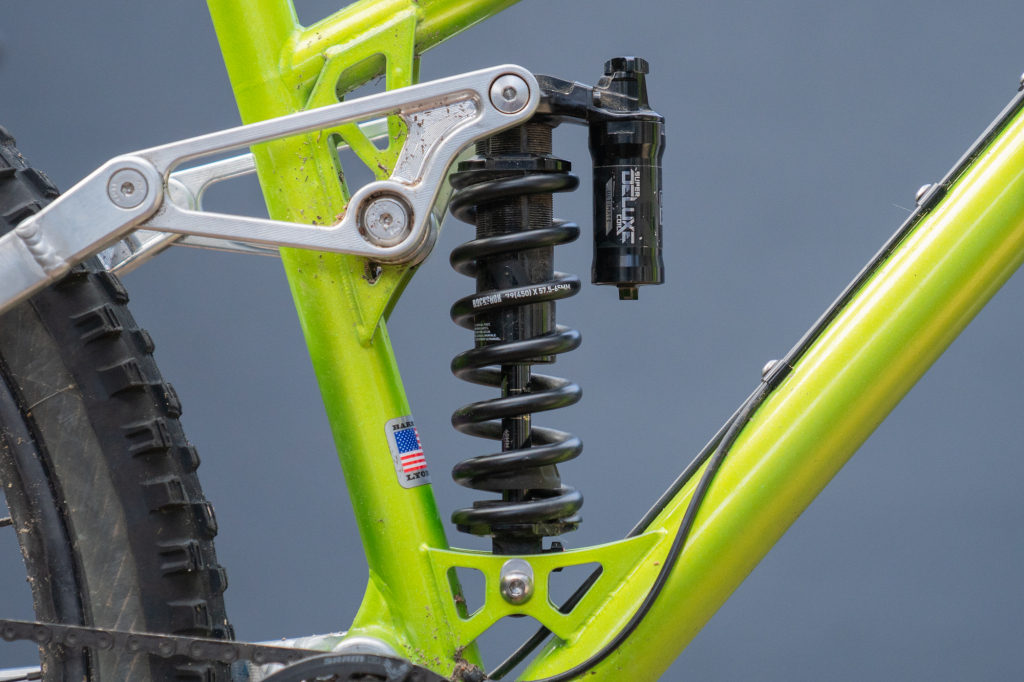
Progressive leverage curves generally aim to leave the rear shock more supple in the early stroke for improved small-bump and touchdown softness, and more supportive in the mid-stroke for better pedaling and pumping performance. In the late-stroke, they sometimes remain progressive to maximize bottom-out resistance, or to pair better with a coil-sprung shock’s lack of natural ramp-up. But others flip slightly regressive in the late stroke to counteract an air shock’s natural tendency to ramp up.
Again, these are curves, so they come in many shapes. For example, if a leverage curve starts with a very brief steep segment and quickly transitions to a more gradual slope, it’s may tend to be supportive at sag and supple over small bumps, but less supple over mid-sized bumps. Or, if that steepness instead doesn’t mellow out until past sag, it will have generous touchdown softness, but may feel less peppy. Starting regressive can potentially deepen that early-stroke sensitivity.
Linear Curve
It would be effectively impossible for a bike frame to yield a perfectly arrow-straight leverage curve, but if there’s not much change in leverage ratio from start to finish, it is considered “linear.” Some single-pivot designs create linear leverage curves throughout most of the stroke. This means that the single-pivot “simplicity” mantra goes beyond just aesthetics. There’s no unseen hand influencing how your suspension will feel, aside from the shock itself. And you have a fair bit of control over the shock. More control than you would if you were setting it up around a complex leverage curve.
This approach isn’t necessarily striving for the “best of all worlds,” with promises of maximized initial bump sensitivity, mid-stroke support and bottom-out resistance. While those are all good things, you may not value each to the same extent that your frame designer does. A linear leverage curve lets you choose if you want your bike to hug the ground or to be more responsive, accepting that there may be some trade-offs in the process of making your bike behave exactly like you want it to.
Regressive Curve
This approach is rarely seen outside of the XC race category, where the air shocks have very small air-spring volumes and are thus naturally very progressive. A regressive leverage curve counteracts that progressivity to make it easier to access more of the travel. If a regressive leverage curve were used on a bike with a larger-volume air spring, the rider would either have to set a high shock pressure to achieve late-stroke support at the cost of small-bump sensitivity, or vice-versa. But on a short-travel bike, it can yield a simpler, more optimal overall feel.
Again, leverage curves are curves. They might combine all three of these, so when evaluating your next bike’s leverage curve, you may have to apply each concept to each segment you’re looking at. And you’ll have to lay it against what you know about the shock, how it is set up, and how it can be set up. And of course, there are other factors that are even weirder.
Anti-Squat
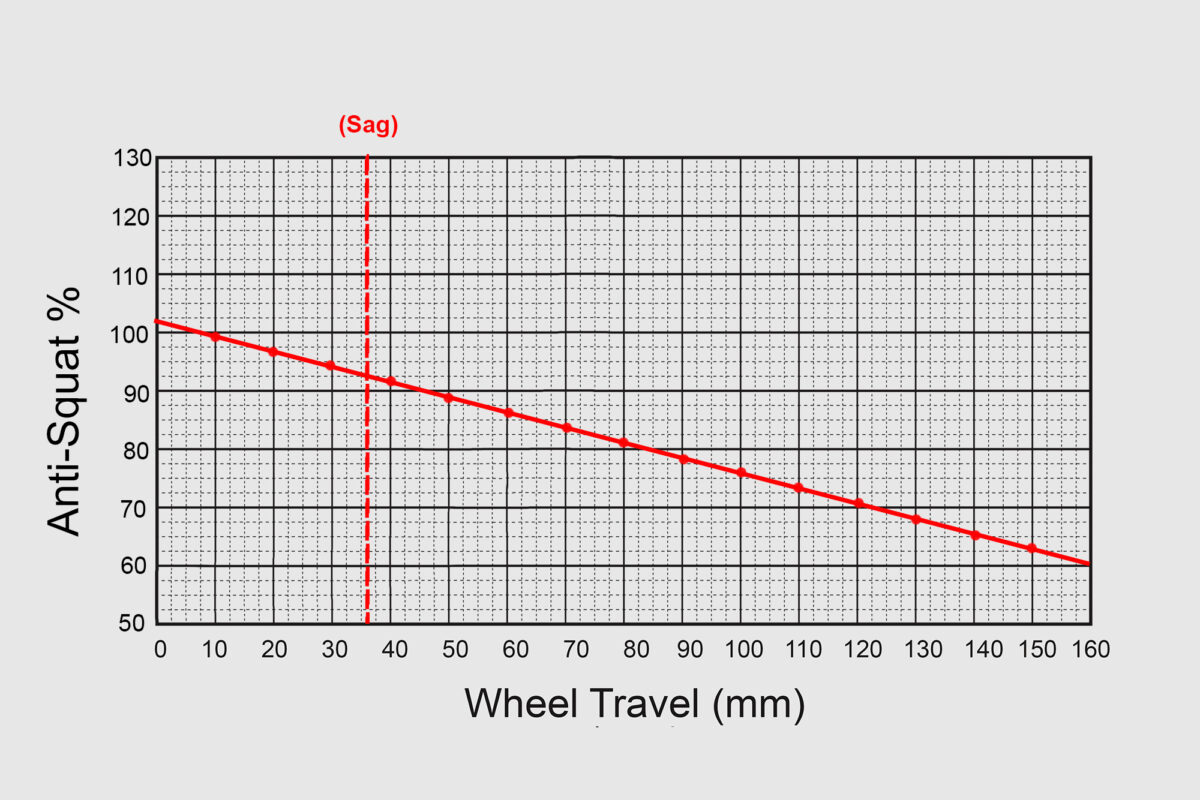
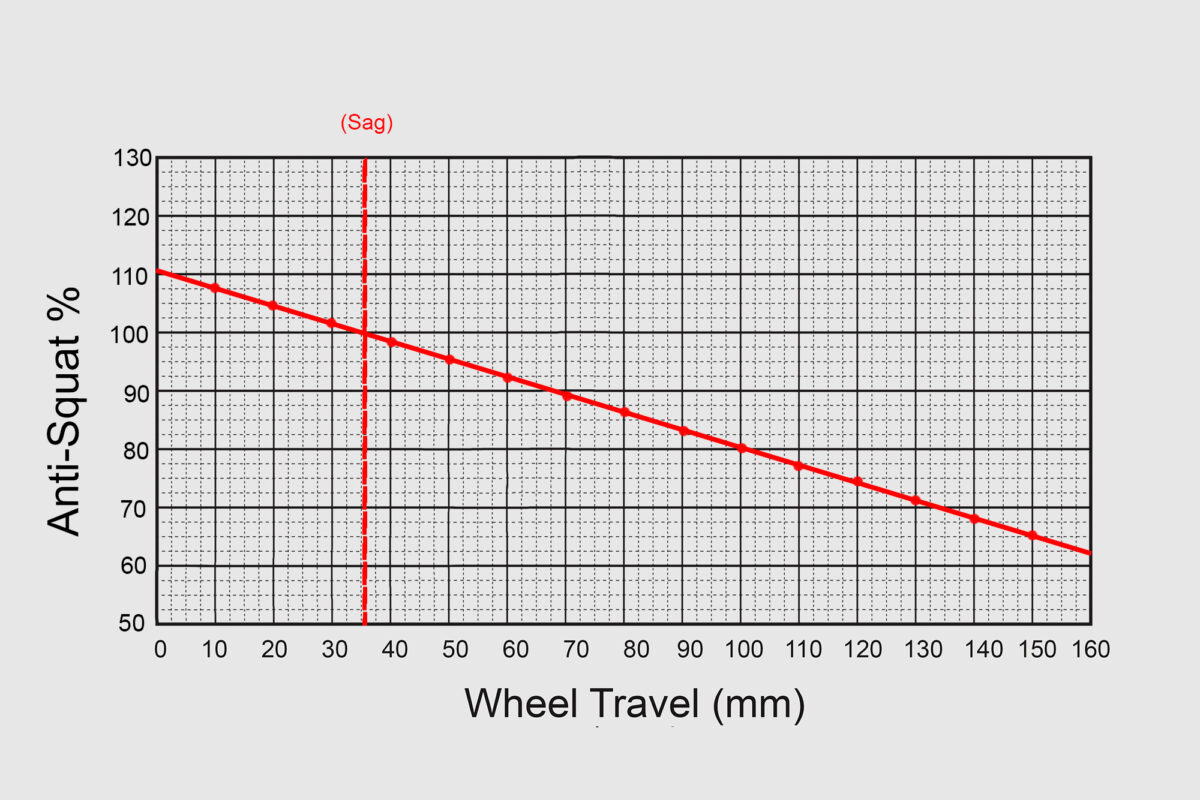
An anti-squat curve (some of which are nearly straight) illustrates how your pedaling force impacts the rear suspension at various points in the travel. Depending on several factors, that force may compress the bike deeper into its travel (squat) or lift the bike out of it (anti-squat). Just like leverage ratios, anti-squat values will change throughout the shock stroke. For reasons we’ll cover in a moment, this value is presented as a percentage. An anti-squat value of less than 100% means that the act of pedaling will tend to compress the suspension, and a value of more than 100% will tend to extend it. A value of 100% is totally neutral, letting the suspension react to the ground as if there is no pedaling force at all.
Within reason, there’s not necessarily a right or wrong anti-squat value. Frame designers will configure their linkage to be more supportive or less supportive, depending on how they intend the bike to behave. High anti-squat values will feel quicker on smooth ground, but lead to hang-ups and poor traction in rough terrain. Low or neutral anti-squat values will be smoother, but may feel sluggish. Some advanced linkages claim to be able to keep you in their intended optimal range throughout more of the travel. Generally, the most important part of the curve is at sag and through the midstroke. You’ll also notice that most anti-squat curves angle downwards. This is partly a natural result of what happens when most bikes compress, but is also fortunate because it would be unhelpful if your drivetrain suddenly ramped up its battle with your suspension in the hardest impacts.
The Problem With Anti-Squat Curves
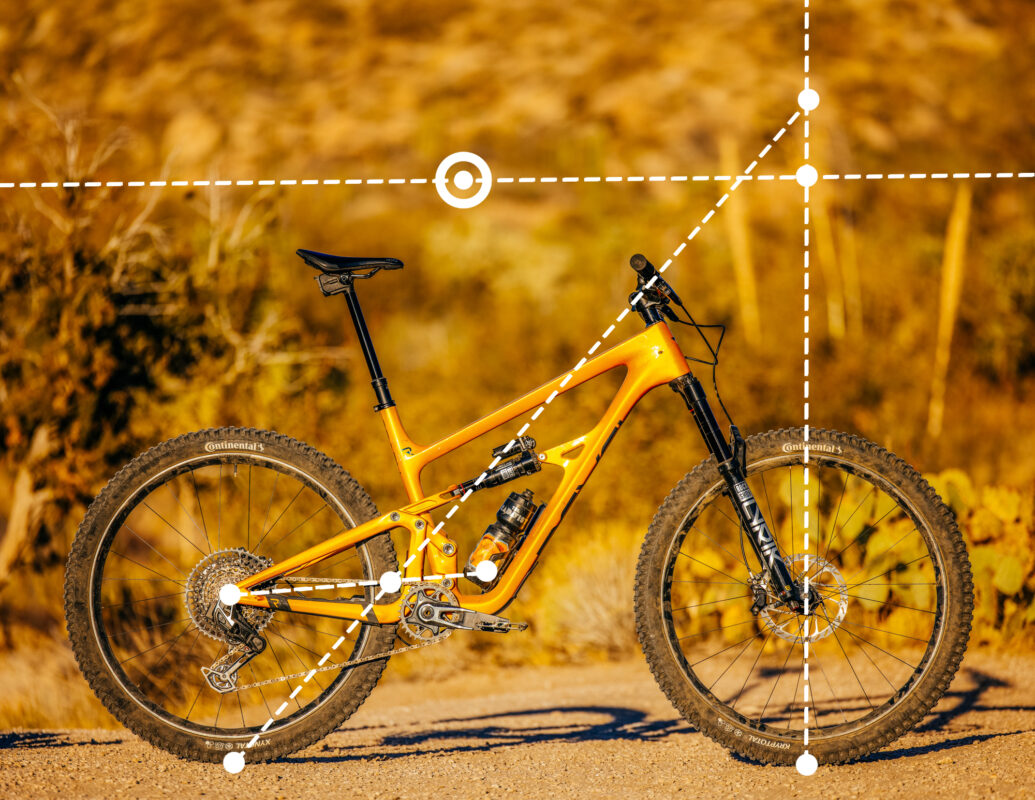
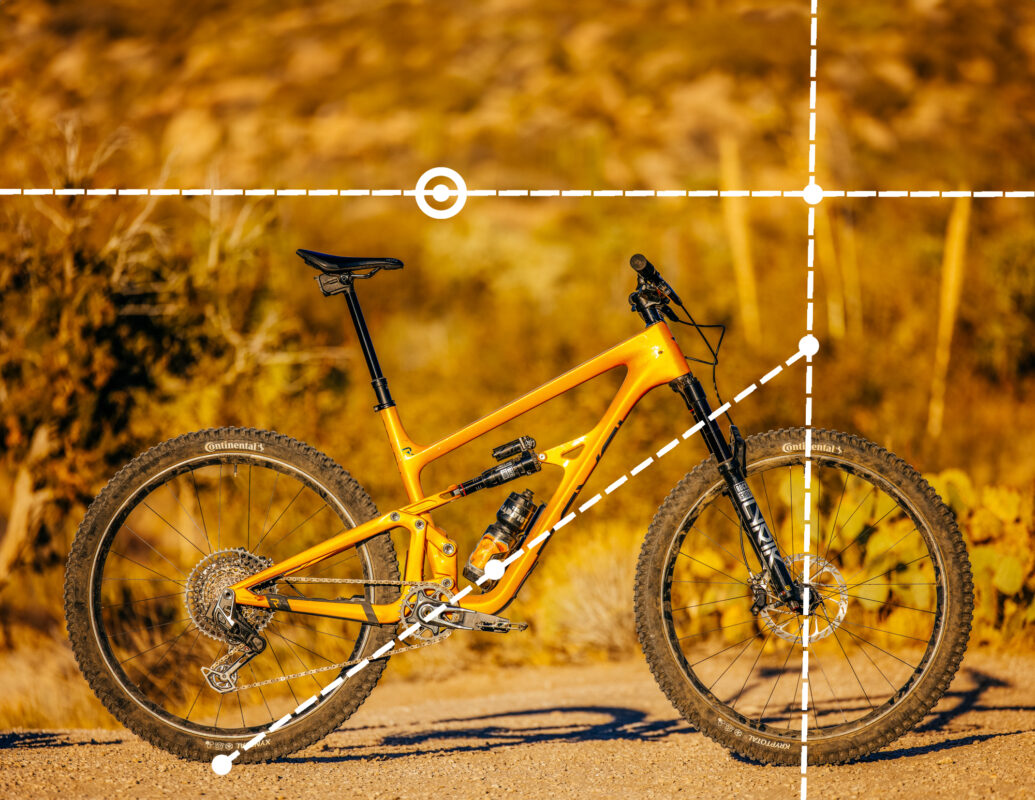
While shock configuration is the only major variable in analyzing a leverage curve, there are far more factors obscuring what a bike’s anti-squat curve actually means. Calculating anti-squat factors in your chainring size, your cog size, your sag, your rear-center, your front-center, your suspension’s instant center, your center of gravity, and gravity itself. Drawing lines through various points gets you several measurements. The ratio between two of those measurements is your anti-squat value for that particular point in the bike’s travel. When a brand publishes an anti-squat curve, they have to make assumptions about several of those data points.
Also, this is all happening alongside the shock settings and the leverage curve, both of which can potentially provide enough suppleness or support to mask or effectively eliminate any unwanted squat or anti-squat. Basically, anti-squat charts are not perfect, but they are not useless. So, let’s take a look at what they might mean.
High Anti-Squat
You’ll often see short-travel bikes aim for high anti-squat because they’re usually aimed at racer types who abhor mushyness. Also, the negative effects of high anti-squat (hang-ups and poor traction) are less pronounced when there’s less travel to disrupt. But you’ll still sometimes see it on moderate and longer-travel bikes. Again, this can make smooth-surface climbs more efficient. Also, if you find yourself using a lockout on most of your climbs, the unsettling interaction between drivetrain and shock will be somewhat muted.
Neutral Anti-Squat
Though there’s no such thing as totally neutral anti-squat, some brands claim to offer minimal drivetrain / linkage interaction for much of the sag range. It’s arguably the holy grail if you have a lot of bumpy, technical climbs on your trails, but it’s not for everyone. Although a neutral anti-squat is preferable to excessively low anti-squat, some riders may prefer the support offered by bikes with higher anti-squat values at sag.
Low Anti-Squat
Frame designers who want to offer supple suspension performance under heavy pedaling load normally need to use complex linkage designs to achieve it. Simpler designs may need to prioritize one side or the other. If a single-pivot-frame-designer values traction over pep, they may opt for lower anti-squat values at sag. Thankfully, they can build in whatever leverage curve and shock settings they want, which can make up for much of the support a low-anti-squat design may give up.
After well over three decades of full-suspension design evolution, it’s rare for a bike’s anti-squat characteristics to be distractingly bad. That’s especially true now that single-ring drivetrains have simplified things. It’s a subtle factor that should not be the driving force behind your next purchase. But it’s not as subtle as our final topic.
Anti-Rise Curves
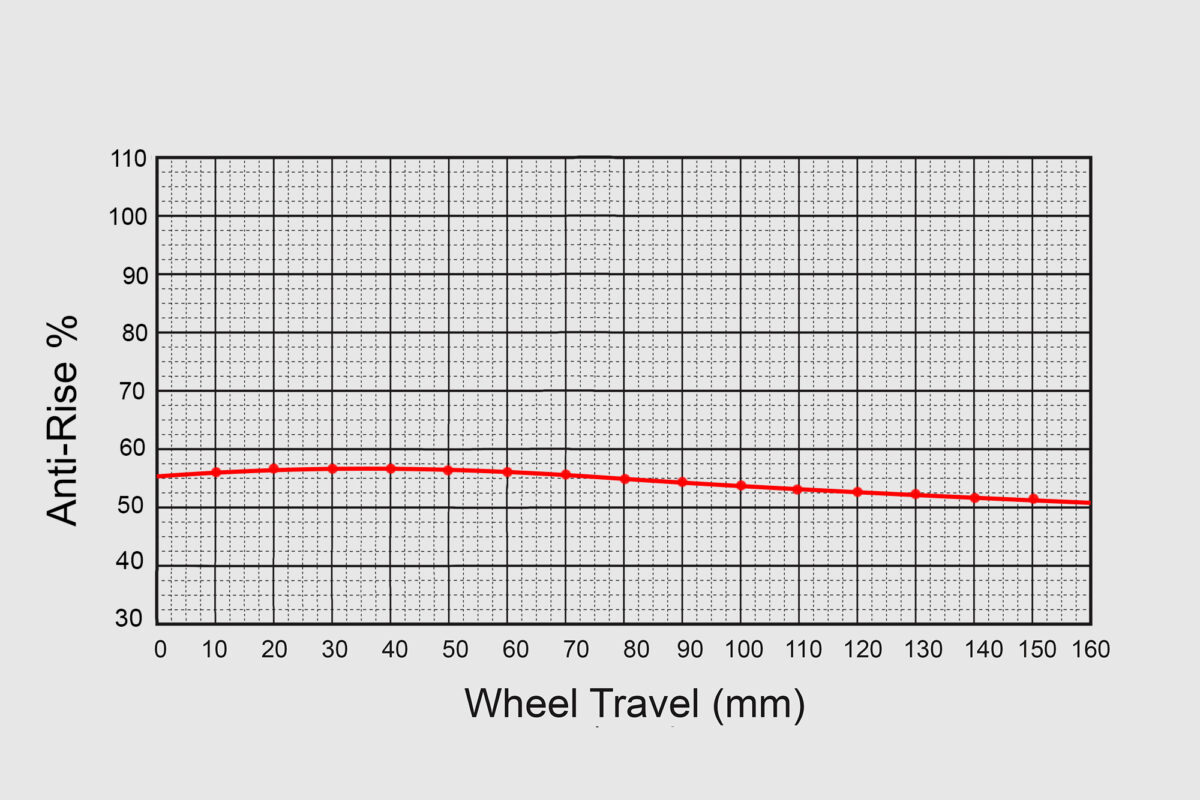
If you’re riding along on flat ground and gently pull your rear brake, some of your weight will transfer off your rear wheel and onto your front. As a result, the rear end of the bike will rise. In a real-world scenario, there are several reasons why this happens. A few of them are taken into account when discussing anti-rise.
The Problem With Anti-Rise Curves
There’s a reason brands often share leverage curves or anti-squat curves, but won’t even mention anti-rise. Quantifying them accurately is nearly impossible. There are too many variables for any consistent measurement to actually mean something we can directly relate to a tangible experience. Anti-rise charts don’t take into account terrain angle, front suspension, or even front braking. They use the rider’s center of gravity, the suspension’s instant center, and the bike’s rear center and front center to calculate how applying your rear brake will affect the rear suspension’s tendency to rise. But all (or nearly all) of these values will be constantly changing in a real-world scenario, and in a way that will have a greater impact on braking behavior than pedaling behavior. But that doesn’t mean anti-rise doesn’t play a role in how you stop your roll. So, let’s briefly touch on it.


Anti-Rise In Brief
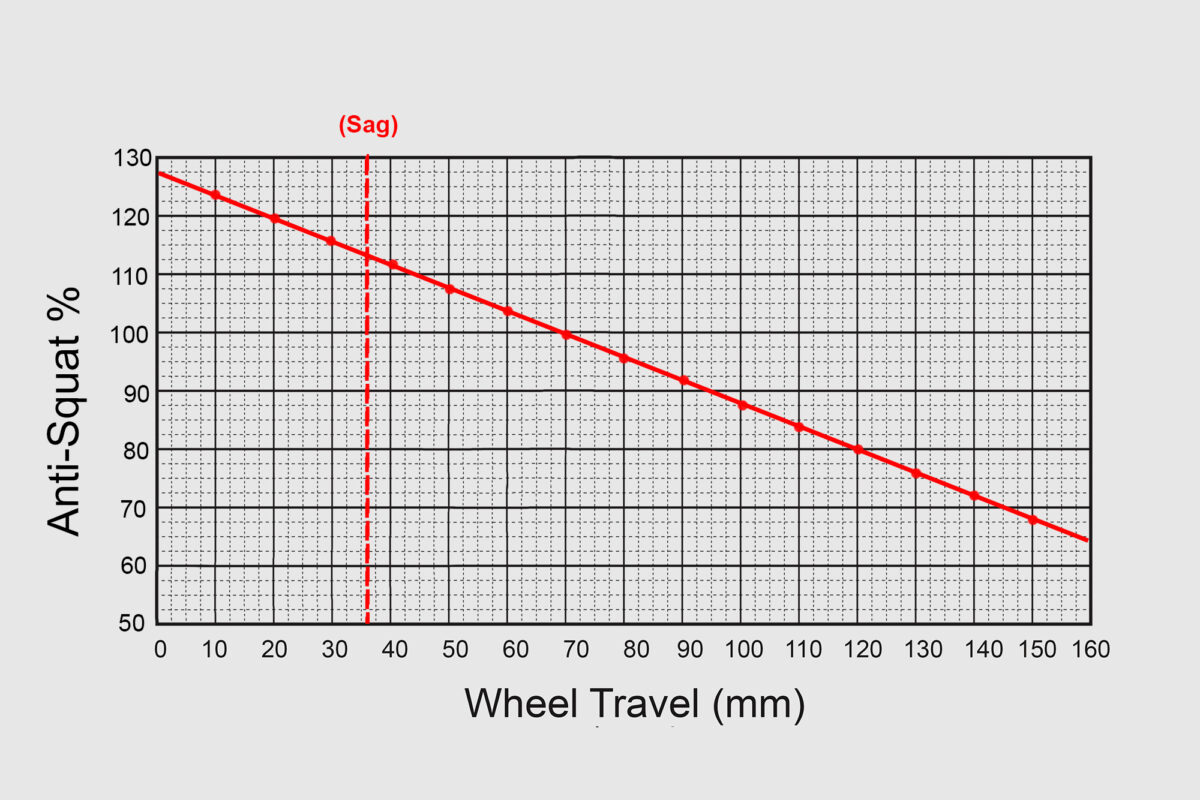
It’s most common for bikes to have anti-rise values that stay below 100%, sometimes even dropping below 0% near the end of their stroke. At 100%, that hypothetical scenario of flat-ground, rigid-fork, rear-brake-only braking would result in the rear suspension neither rising nor squatting. As the numbers drop, braking force is more likely to allow the rear end to rise. The theory behind keeping anti-rise values below 100% is that they help leave travel on the table for ensuing impacts. But it is also possible to have anti-rise values above 100%, which will theoretically cause the rear end to squat under rear-brake force. This is common among high-pivot bikes, which are known for their stability. Although such a high anti-rise value takes travel off the table, it can have the effect of leaning the bike back, optimizing geometry in the kinds of descents that are likely to see hard braking.

Again, anti-rise should not be the first thing you look at when buying your next bike. In fact, none of these metrics will tell you everything you need to know about how a bike’s rear suspension will behave. But they will tell you some of what you need to know. And you don’t even have to go through a Radavist editor’s many complex emotions to get there.