

Welcome to the 2026 Fantasy Baseball Season!
Hi Folks,
Welcome to the start of our
2026 Fantasy Baseball Season!
For those new to Fantistics: With the advances in data collection,
there are new indicators introduced every season which aid us in breaking
down a player’s core skill/ability. Indicators that measure batted ball
speed, quality of contact, and location are helping us refine our
projections model into unprecedented territory. Indicators such as HR/FB
rates are no longer looked at as universal or blanket rates. Each hitter
has a unique ability to control and command these rates, and we’re finding
that the determining factors are more eloquent than just simply batted
ball speed. Directional tendencies are now charted and those with a
higher pull% tend to compensate for lower batted ball speeds, while those
with higher opposite field ability tend to command a higher BABIP.
Our batter projections model separates each projected plate appearance
into one of three categories: ground balls, fly balls, and line drives.
From there, indicators such as: quality of contact, speed, home park
factors, and direction of contact help us ascertain the likely outcome of
a player’s batted balls. Needless to say, I’m excited about the
correlation relationship that we’re seeing in our baseball forecasting
model.
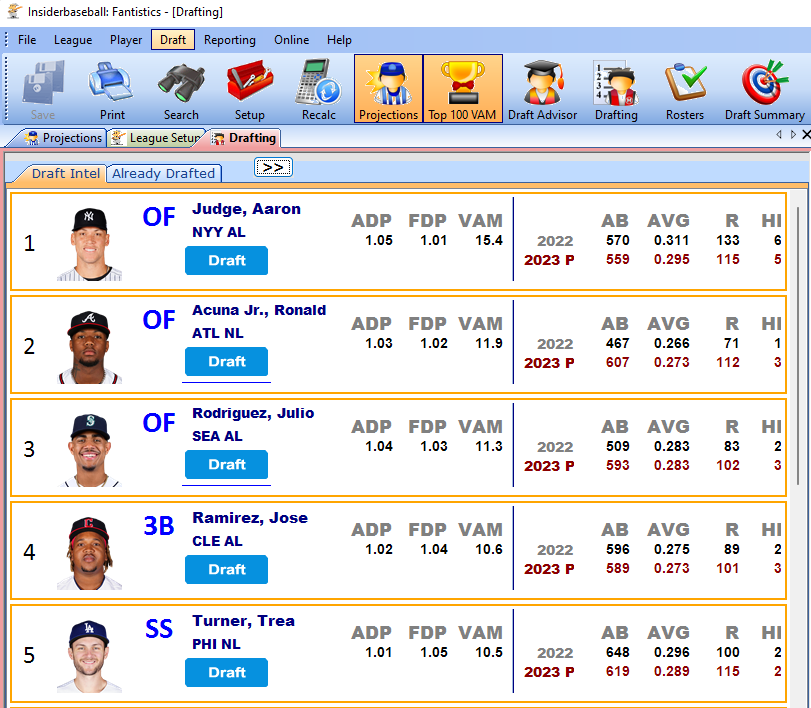
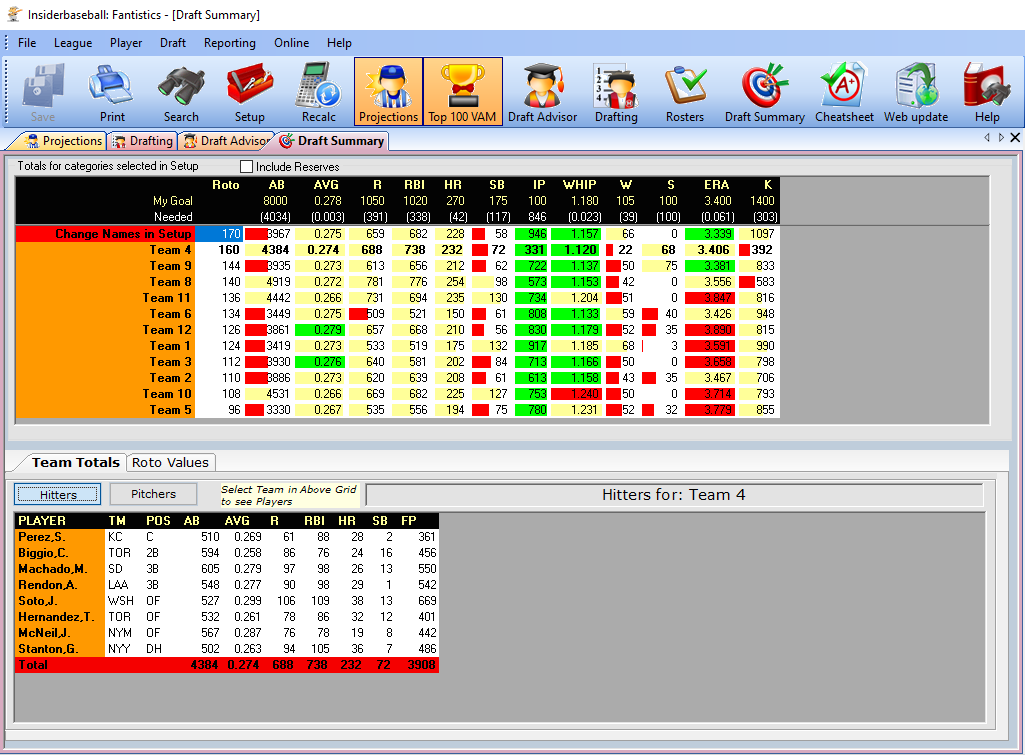
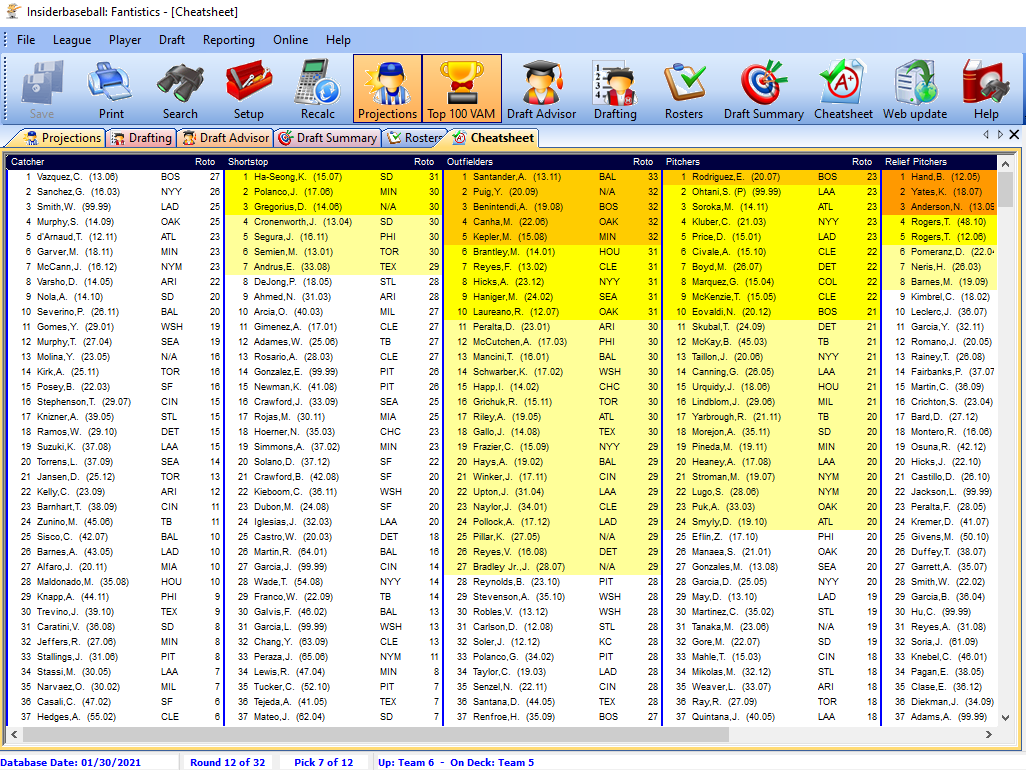
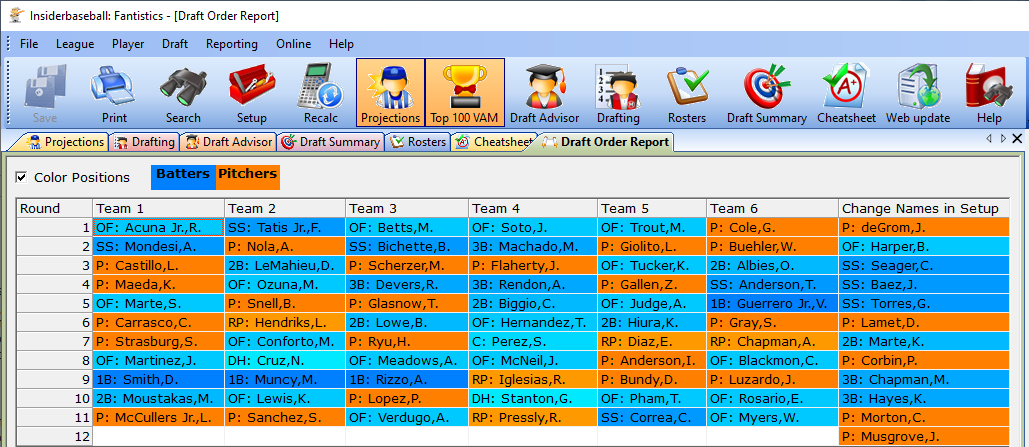
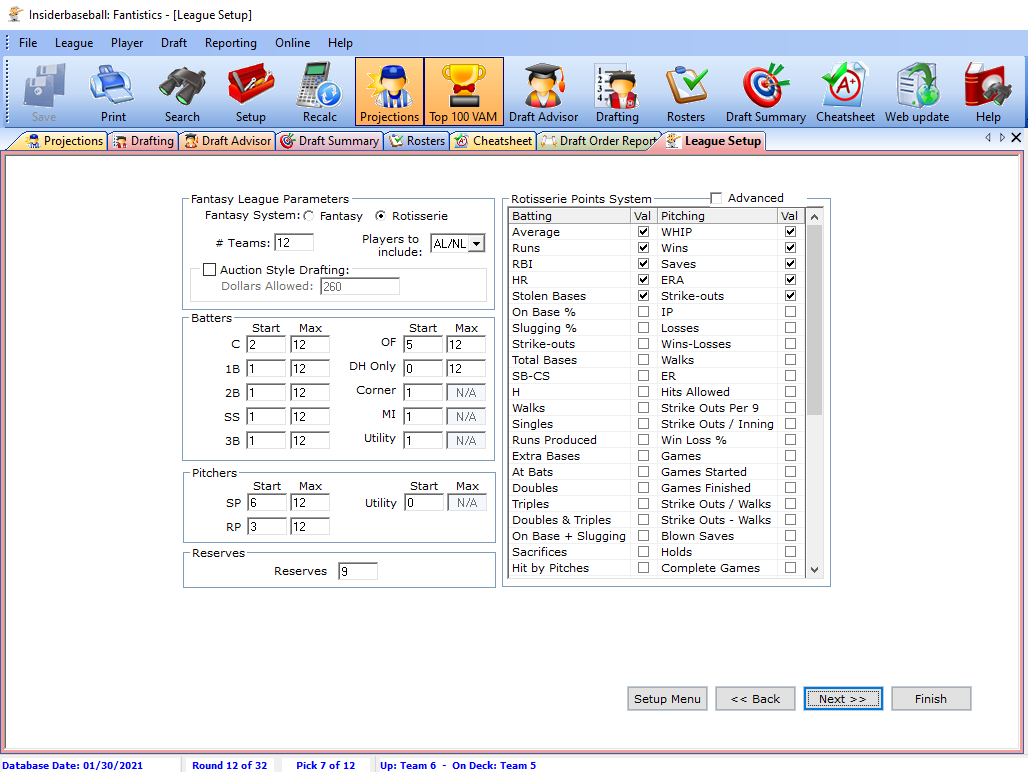
Below are some of the
screenshots of Player Projections | Draft Advisor program:

Whether you are utilizing our player projections software to produce customized cheat sheets,
research player historical trends, as a live draft advisor, or as a Mock Draft
tool, the 2026 version is wired for your fantasy
championship quest. Once again, back this year will be
all of the essential season services including our Minor League
Prospect Central, Analysis & Press News, Player Production Charting,
Player Recommendations, Player Tracker, online fantasy databases, 14 day
pitching rotations, and our weekly lineup submission aid.
Over the coming days we’re going
bring you a different perspective served up by some of the best
analysts in the business. If you are new to us, please be sure to
sign up for our
free player projections newsletter.
The end game is of course providing you with a competitive season,
and we hope that you’ll start it with what we believe is our best product to
date. Stacking the odds in your favor from draft day, round by round, to
season’s end. Click here to
register for 2026.
Fantistics Draft
Advisory Software
Helping you win your
Fantasy Baseball League in 2026
Once again inside the Fantistics Draft Advisor: are a slew of critical Sabermetric indicators to the Fantistics Fantasy Advisor. Categories which we consider to be some of the best
indicators in explaining a player’s performance.
Hitters:
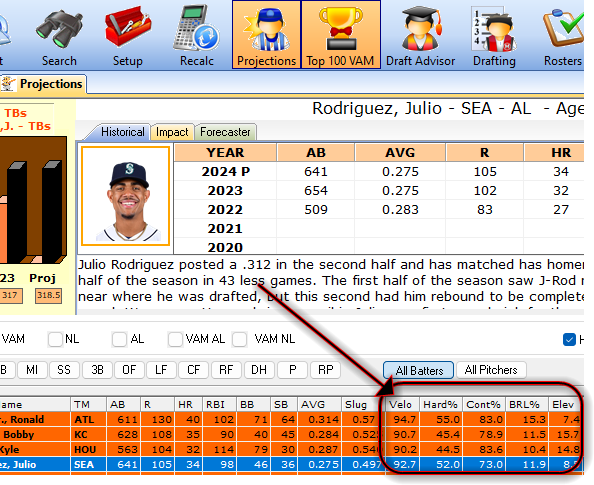
Velocity (Velo):
Expressed in MPH, Average batted ball speed off a hitter’s bat. League average for top 200 hitters is 89.1 MPH
Contact% (Cont%):
Percentage of balls that where hit (fair or foul) verses missed. League
average for top 200 hitters is 78%
Barrel% (BRL%): Batted
balls that have a superior combination of Batted ball speed and launch angle.
Defined by Statcast as having led to a minimum .500 batting average and
1.500 slugging percentage since Statcast was implemented Major League wide
in 2015. League average for top 200 hitters is 8.4%.
Elevation (Elev):
Average Launch Angle of batted balls. Helps identify groundball hitters, who
could benefit from a lift in swing. League average for top 200 hitters is
12.6%.
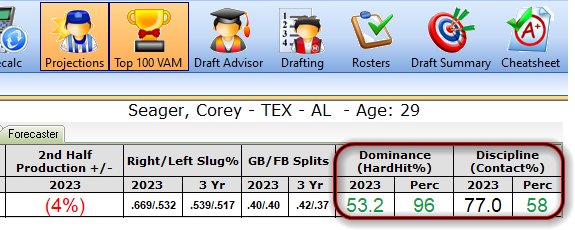
HardHit% (Hard%):
batted balls with an exit velocity greater than 95MPH divided by total balls
hit in play. League average for top 200 hitters is 40.2%. Also expressed in
Percentile.
Contact% (Cont%):
batted balls contacted divided by total swings. League average for top 200
hitters is 78%.
Pitchers:
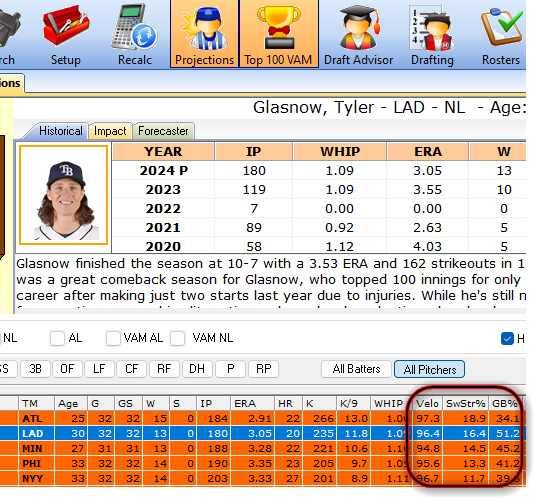
Velocity (Velo):
Expressed in MPH, Average speed of fastball. League average
for top 120 pitchers is 93.6 MPH.
GB%: Groundball rates
thrown by pitcher. For some pitchers, groundballs are considered fundamental
in keeping a pitcher’s ERA respectable and predictable. League average for
top 120 pitchers is 42%.
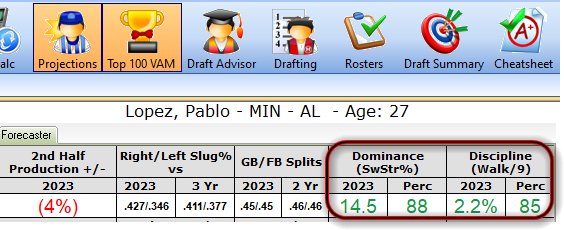
SwStr%: Swinging Strike
Rate. Percentage of balls thrown that a batter swung and missed. A sign of
dominance. League average for top 120 pitchers is 11.1%. Also expressed in
Percentile.
BB/9: Walk Per 9. Along
with SwStr% and GB%, Walks per 9 is one of the three tenants that we use to
quickly measure success for pitchers. Pitchers who keep walk rates below
league average typically have an ERA which is below league average. League
average for top 120 pitchers is 2.9%.
2025,
2024,
2023,
2022,
2021, 2020*,
2019,
2018,
2017,
2016,
2015,
2014,
2013,
2012,
2011,
2010,
2009,
2008,
2007,
2006,
2005,
2004,
2003)
![]()
Catch the latest Fantistics Baseball Podcast
on
Apple,
Spotify, and
Google Play