

Can autocrossers take advantage of data analysis? Of course. And easily, too.
There are plenty of excellent data options for today’s autocross enthusiast. In addition to the autocross-centric SoloStorm suite, both the Apex Pro and VBox can be configured for point-to-point runs.
[Go faster in autocross: The apps, sensors and traces you need]
So let’s compare two drivers in the same car at the same event, the 2025 edition of the Lone Pine Time Trials in Manzanar, California.
Even though the Lone Pine Time Trials took place on a course that covered a little more than 2 miles with speeds eclipsing those usually seen at a local autocross, all of the classics were there: slaloms, offsets, increasing- and decreasing-radius corners, steady-state cornering and hard transitions.
This expanded layout also makes data analysis a little more straightforward since maneuvers aren’t stacked on top of each other as they might be in a more traditional autocross.
For this data review, we’re going to concentrate on two charts (although there will be guest appearances by other charts). The first is our speed trace, and the second is the delta graph, which is a handy feature in Circuit Tools for comparing the relationship of two laps over time. The delta graph simply shows how much and how quickly one lap is gaining or losing to the comparison lap, making it an excellent tool for autocross comparisons.
We start out with some runs in Bret Norgaard’s 2005 Acura TL prepared for the Street Modified FWD class. He’s won more than his share of national-level autocrosses in this car, and it’s well prepared and an absolute blast to drive.
The green trace is Bret’s, while the red trace is mine. I was driving the car for the first time at Lone Pine and found it to be highly accommodating for such a prepared-to-the-edge-of-the-rules sort of machine. The two runs we’re looking at both come from our best runs on Saturday, when Bret beat me by around 0.6 second.
Figure 1
We’ll start out around the 800-foot mark, where Bret misses a shift into fourth (Figure 1). You can see his speed drop further and for more time than mine, and that delta graph steepens its descent.
When looking at the delta graph, think of it this way: When it’s sloping down, I’m gaining time. A steeper slope means that I’m gaining faster. When it’s going up, Bret is gaining time. When the line is above the horizontal zero plane, Bret is ahead, and when it’s below, I’m ahead. That’s why the delta graph is such a great tool for comparisons: It shows exactly where you’re gaining or losing speed.

Figure 2
So after that missed shift, we enter a slalom at around the 1500-foot mark (Figure 2). My speed through the first few slalom cones is solid, while Bret’s is fairly inconsistent. He’s out of rhythm after that missed shift. The delta graph shows some big gains for me here, pulling out a 1-plus-second lead as we exit the slalom and head through a sweeper.
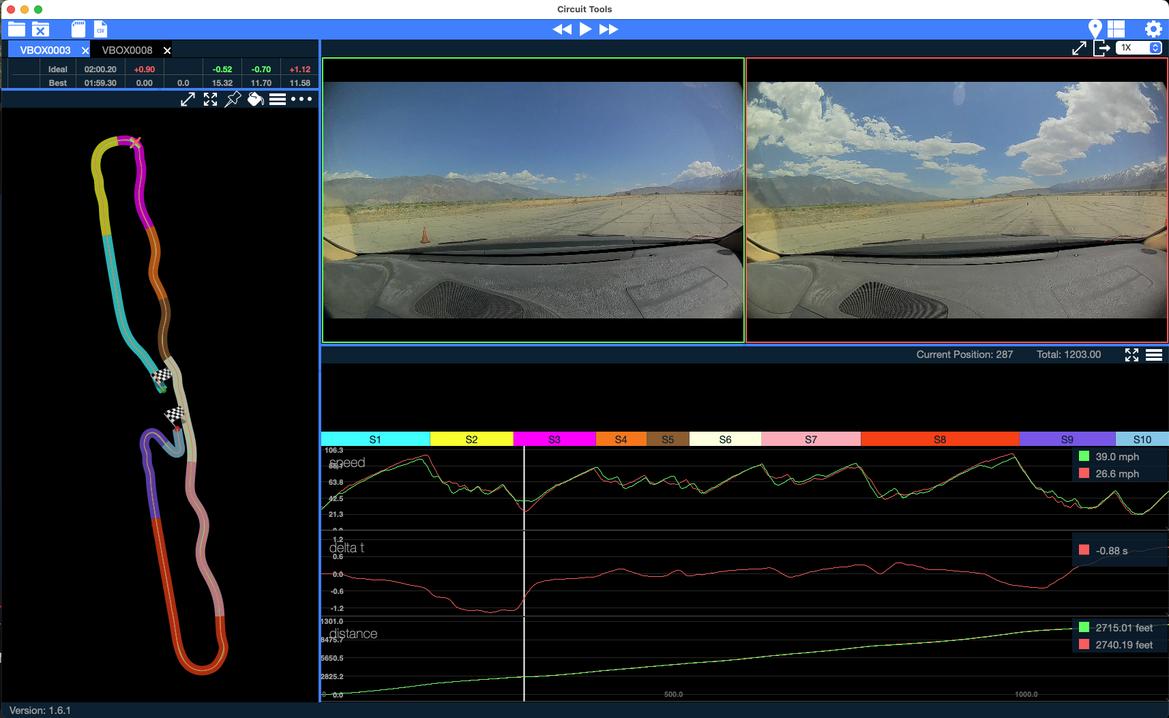
Figure 3
Then, I blew it (Figure 3). As the sweeper tightened up, I got too wide–the positional graph shows as much–and got into the marbles. This junk found off the racing line is aggressive and plentiful on the ancient, unmaintained Manzanar concrete.
I slowed to around 25 mph while gathering up things, while Bret kept the car above 40 mph. The delta graph instantly shows that I lost more than a second of my advantage.

Figure 4
The data shows another difference between our driving. Through the offsets from about the 3500-foot mark to the 5000-foot mark (Figure 4), Bret’s speed trace rises and falls very evenly as he negotiates the big, sweeping offsets.
Mine looks a bit more jagged. Although the delta trace hovers nearly horizontal through the sequence, it’s clear that I’m working harder for the same result, while he’s letting his familiarity and comfort in the car do the heavy lifting.
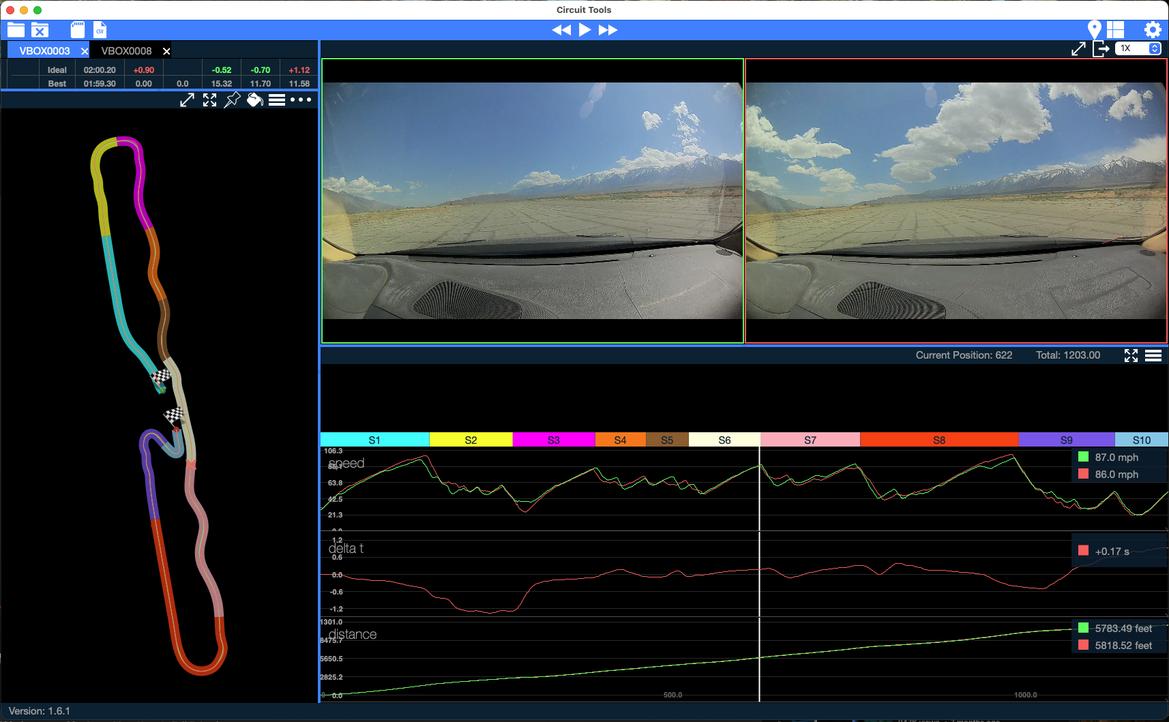
Figure 5
The next set of offsets, from around 5800 to 7000 feet, follow a similar pattern (Figure 5). Bret’s green trace looks smooth and regular, while my red trace is a bit more inconsistent. I had a good entry to the first offset, but I immediately paid for my hubris, and it cost me on the exit.
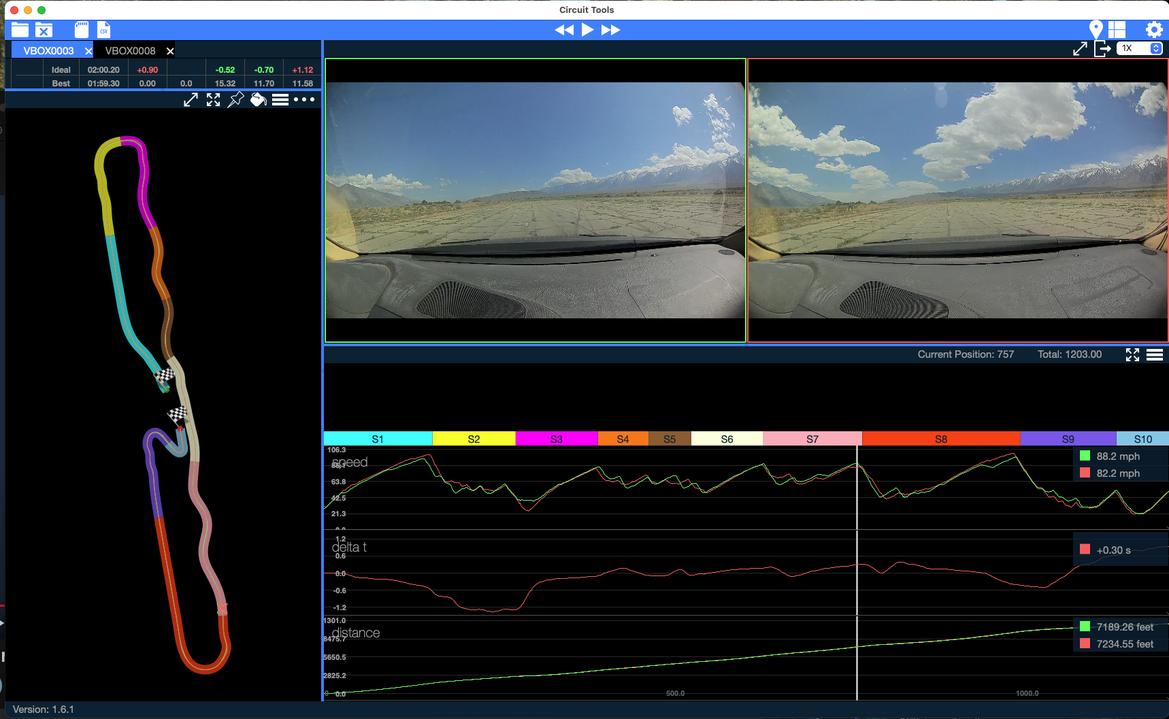
Figure 6
The next section, though, shows how two different approaches both worked fairly well. At 7200 feet, the course slows down to do a 180-degree turnaround (Figure 6).
Bret downshifts into second gear, while I remain in third and take a much wider line. Using the distance tool, we can see that I traveled an additional 30-ish feet on the entry to this multi-radius turnaround. That doesn’t sound like a lot, but you can see that Bret used his tighter line and lower gear to apply some throttle between the multiple apexes. This yields more aggressive acceleration within the sequence, instantly sending the delta line heading back in his favor.
However, my more open line allowed me to ultimately commit to the throttle earlier on the final exit, increasing my speed sooner and shifting the delta graph back toward my side of the table.
This is an important discussion point in autocross data-acquisition analysis because on most autocross courses, literally everything is a compromise. Bret quickly gained time over a 200-foot-long section of course. I gave up time in that section but gained it back on the exit and continued gaining down the subsequent 1500-foot straight.
The key here is that sometimes you have to make sacrifices in small areas to make gains in larger areas. I gave up speed in a roughly 2-second chunk of course, but as a result, I was able to accelerate for almost 17 seconds afterward. Bret gained some mid-corner speed, but he had to wait 3 long seconds to commit to full throttle. During the next long straight, he only got 14 seconds fully on the gas.
The delta graph trends my way down that long straight and heads in an even more aggressive direction through the first couple offsets of a decreasing-distance, six-cone slalom.
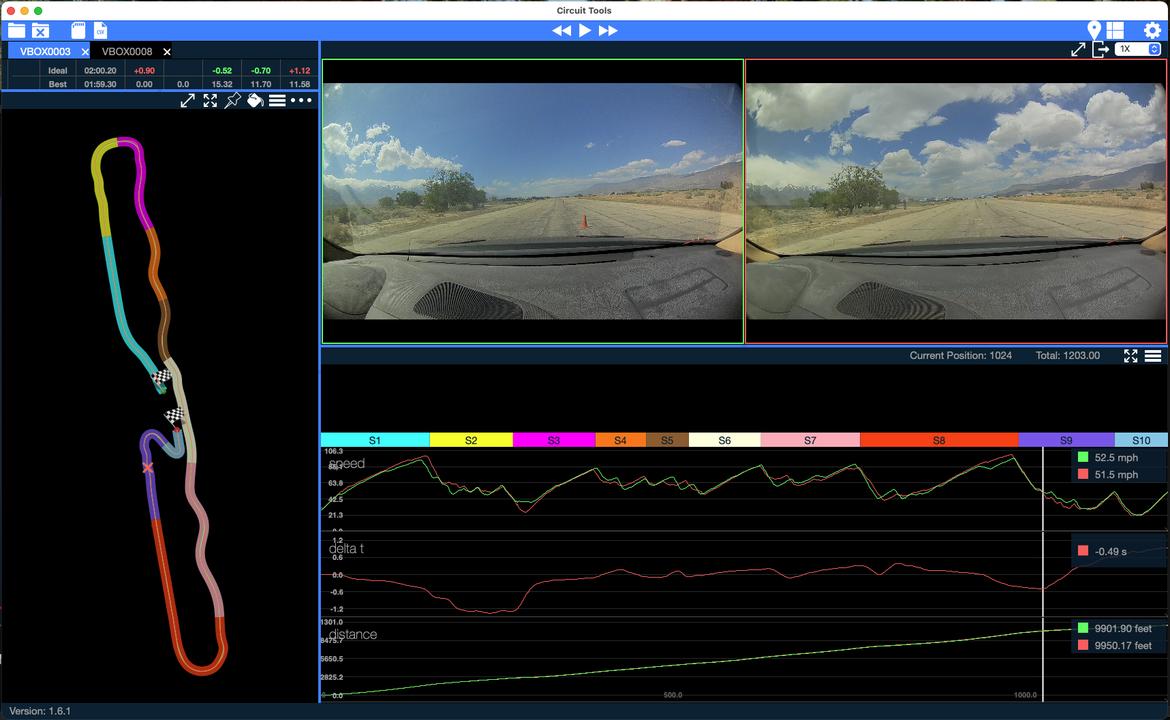
Figure 7
A little past 9900 feet, though, where the slalom really tightens up, is where Bret’s familiarity with the car starts to shine as he cleanly navigates the final slalom cones 4 or 5 mph faster than me (Figure 7).
The final sequence of the run is basically heads up: I lost a bit of time by driving a slightly longer line, which I thought would net me more speed, but the sequence was so short that my gamble never paid off.
So that’s what one autocross run–albeit an unusually fast and long autocross run–looks like to the VBox data system. So, what can we conclude when it comes to looking at autocross data?
Well, everything is connected. Even on a long autocross like this with super-long straights, there’s not much dead space. Any changes that you make are likely going to affect another sequence of the course. What looks like a mistake might be necessary to maximize another segment of the run.
And when making those decisions, prioritize the fastest sections and the ones that you’re in the longest. Giving up 2 mph for 2 seconds is a worthwhile trade-off if it adds 5 mph for 8 seconds soon after.
Still, a good data chart is a good data chart, whether it’s on an autocross or a road course. In general, you want to see sharp peaks, few flats and smooth, quick transitions between everything.
Comments

Figure 6 is interesting though. For a typical autocross, that straight away out of the corner is hardly seen, so it looks like it works out for you in this case but would have been bad if this was a more typical autox course. I always struggle with these two choices though so data certainly helps if you have time to go through them between runs.
Great article and great driving at Lone Pine!

I’m still just in awe of the venue.

JG Pasterjak
Tech Editor & Production Manager
6/4/25 10:58 p.m.
White_turbo said:
Figure 6 is interesting though. For a typical autocross, that straight away out of the corner is hardly seen, so it looks like it works out for you in this case but would have been bad if this was a more typical autox course. I always struggle with these two choices though so data certainly helps if you have time to go through them between runs.
Yeah that was definitely one of the more intriguing spots on the chart and I think it really sums up the comparison very well. Bret was driving on familiarity. With the car, with the course, with the characteristics of the site. I was just sticking to the basics, which pretty much means late apex everything, get your turning done early and find as many straight lines as you can. I was almost approaching it more as a road course than an autocross course. So in that sequence, he was faster getting to the apex but I was faster leaving the apex and it just happened to be a corner that rewarded my approach a bit more because of the long subsequent straight.
Another thing I didn’t really get into much was total distance traveled. My runs consistently covered more distance than his. Not by a lot, and honestly not by as much as I was expecting, but he was definitely driving a cozier line everywhere while I was trying to open everything up. That approach really cost me in that one right hander early on where my desire to increase radius got me out into the marbles. When you look at the actual track through that corner, Bret is on a line I never would have even considered. He just cut a ton of distance and drove point to point. He basically put a couple autocross maneuvers in the middle of the track-style stuff and it paid off for him big time and hurt me big time from not realizing just how bad things got when you got off line.
JG Pasterjak
Tech Editor & Production Manager
6/4/25 11:07 p.m.
RobKrider said:
Great article and great driving at Lone Pine!
Bro it was so much fun, even though you absolutely smoked us all weekend.
For the record, Saturday raw times put me in 7th and Bret in 12th (with cones). His raw time put him about .6 ahead of my best raw. Sunday Bret was 3rd overall and I was 4th, again about .6 apart.
Rob, however, put the wood to the entire field, dominating raw and PAX both days with no one coming within like 1.1 seconds of rim in raw time and crushing PAX by over three seconds both days. I was fifth overall in PAX Sunday, SIX SECONDS off of Rob. Just absolute god mode driving.
Displaying 1-5 of 5 commentsView all comments on the GRM forums
You’ll need to log in to post.